We have collected data from many meadow sites over many years. All this data is contained in the ‘Meadows’ database. The interrogation of this database means we can better understand changes in botanical communities as a result of climate change, site management, changes to site hydrology and soil nutrient status. It is the basis for much of the research carried out within the University on floodplain meadows.
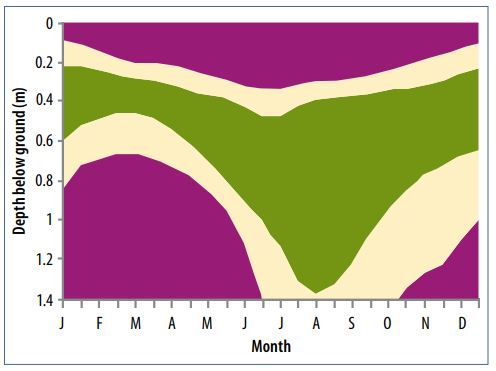
The meadow map shows which sites have data within the Meadows database. We have used this data to create models like the hydrological model shown below, showing the typical water table for the Burnet floodplain meadow plant community (MG4):
 Hydrological model graph